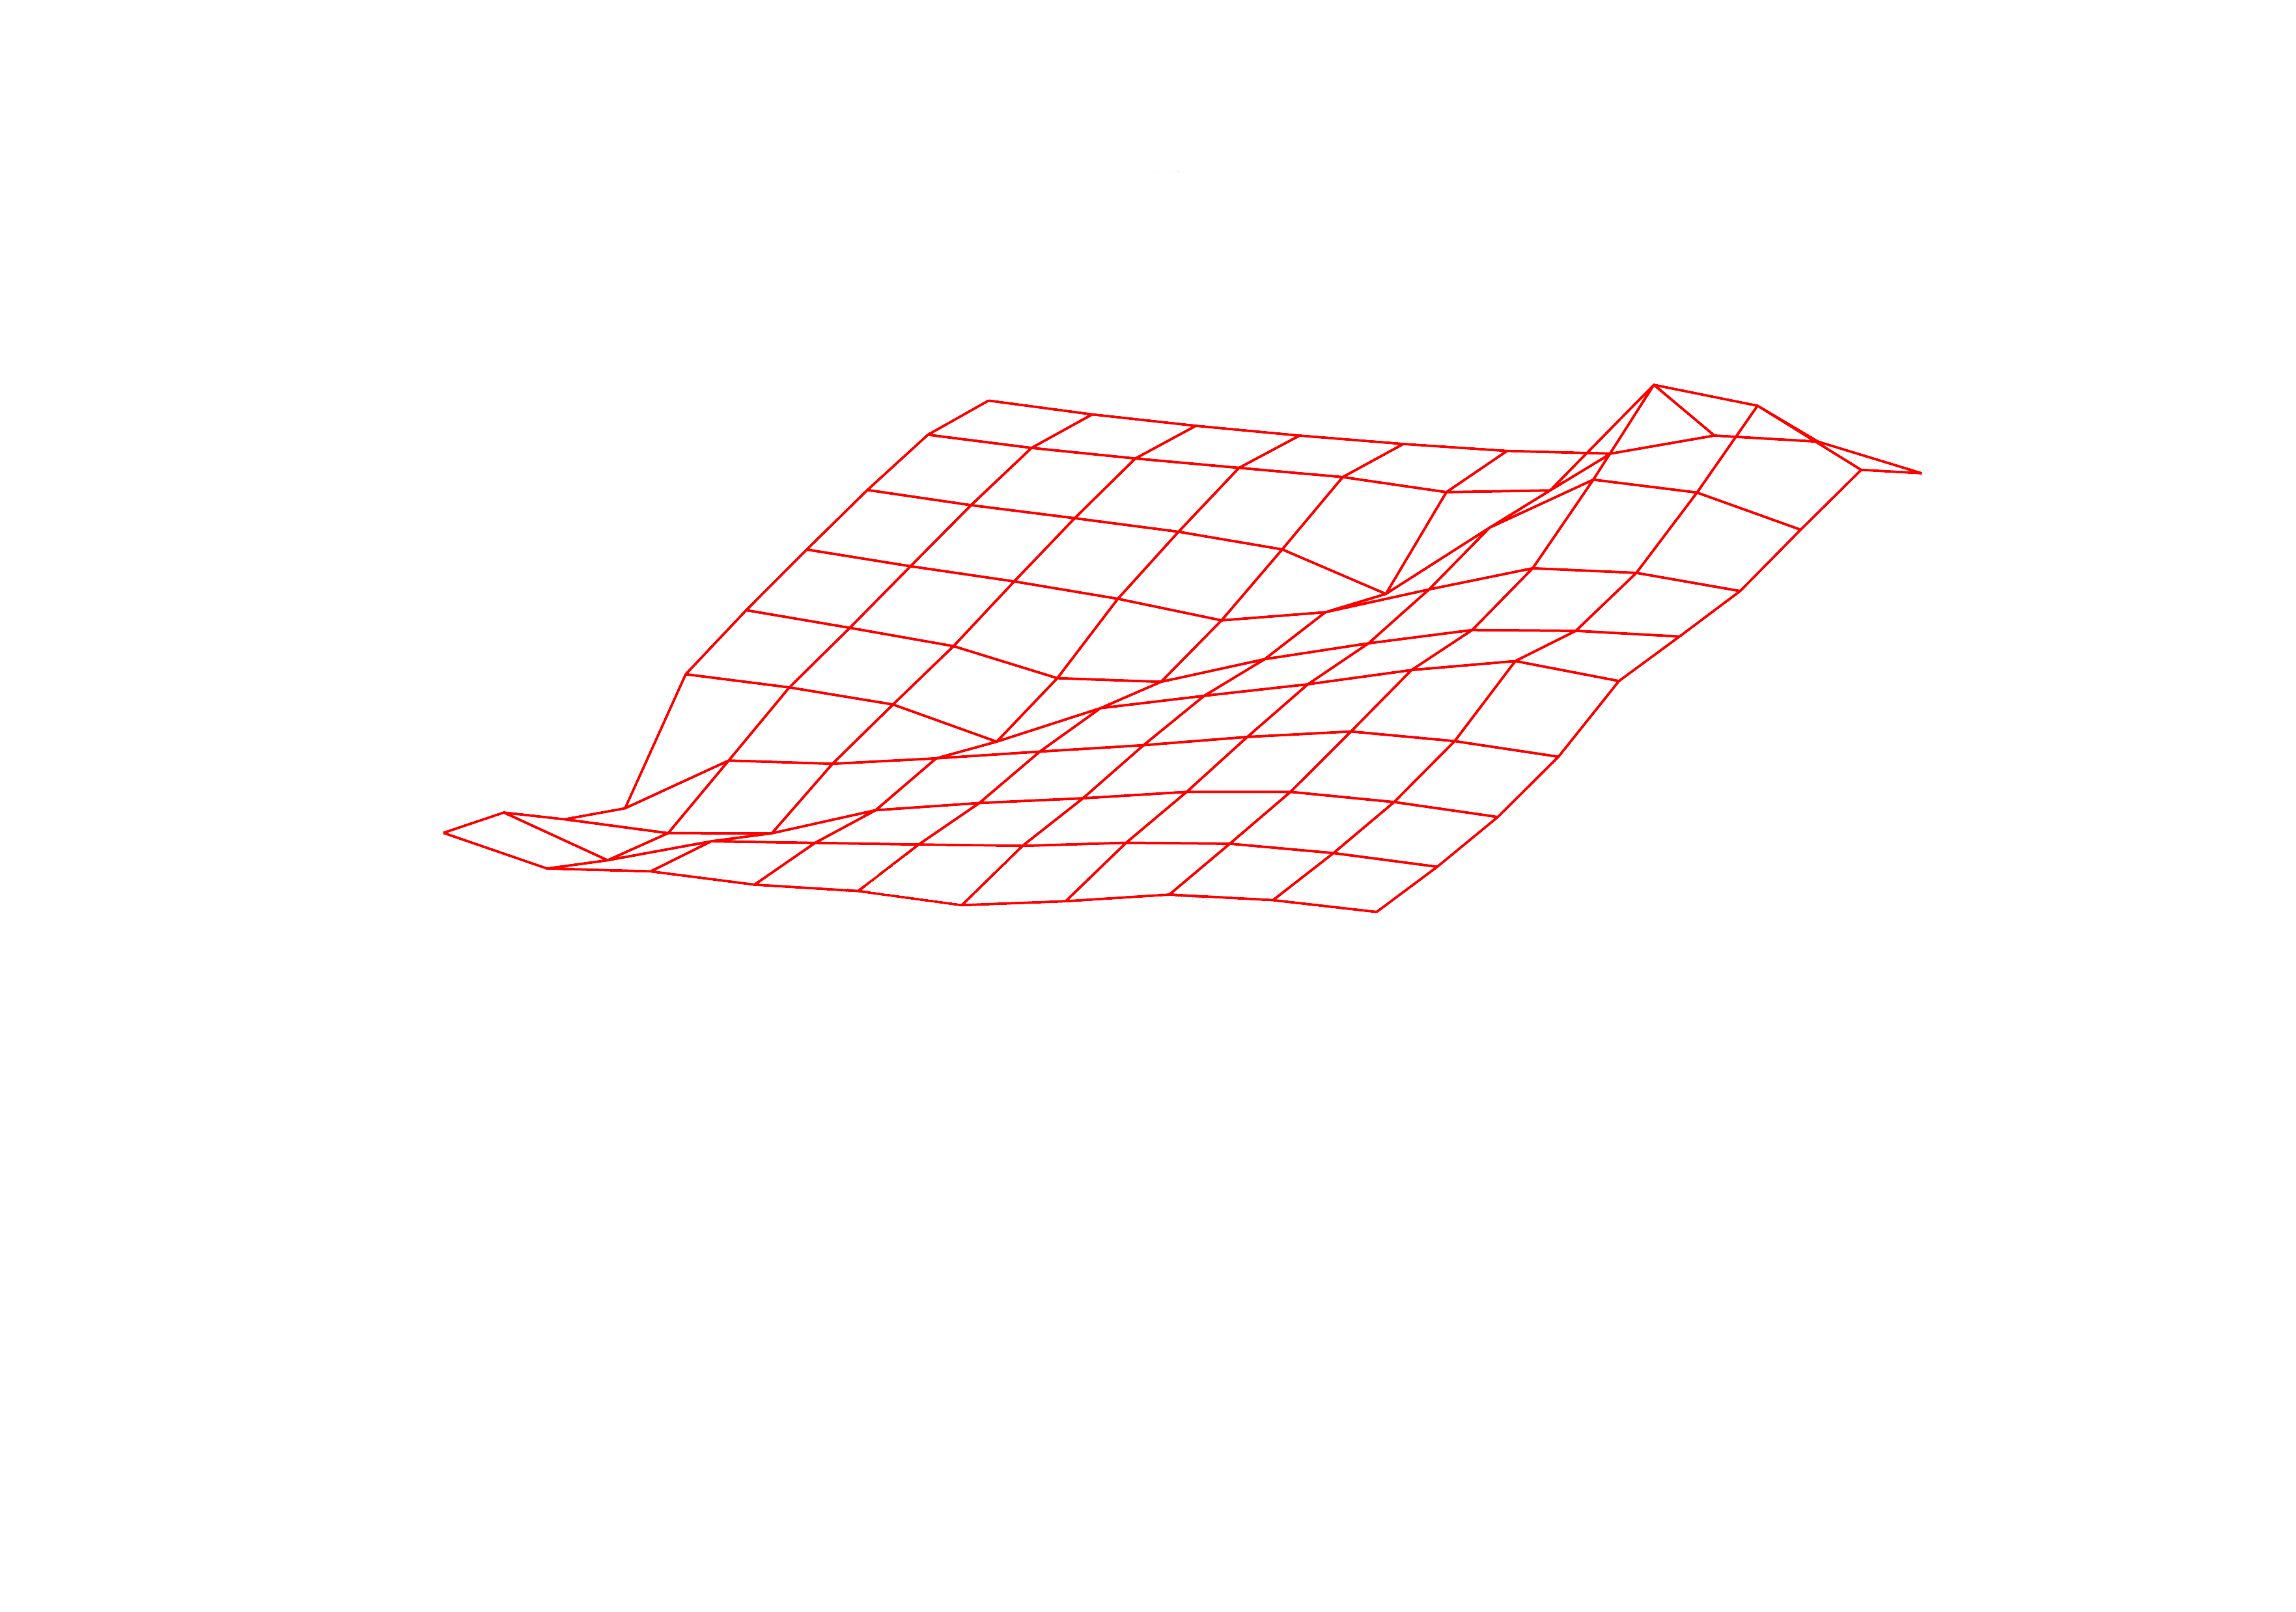
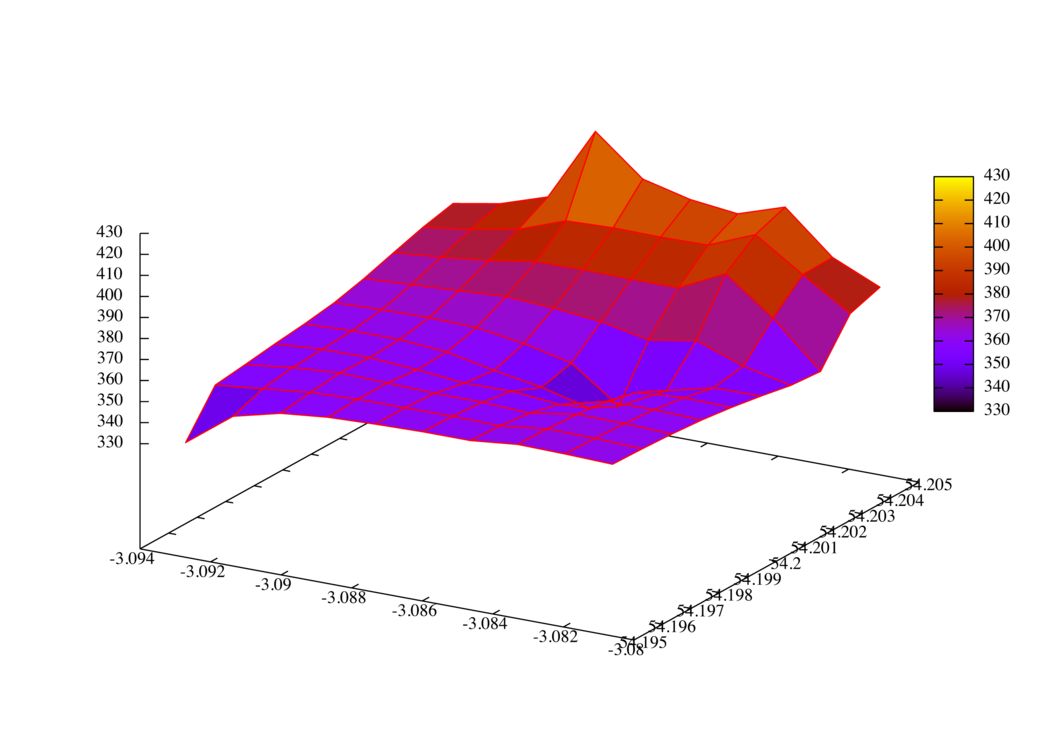

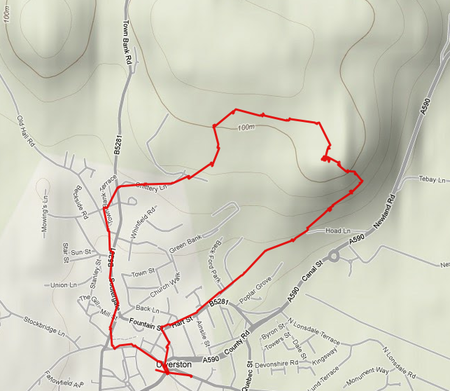
After spending yesterday evening working on a low power version of the sniffers, the sun finally shone on Ulverston today, so I did a quick test run up to the hoad monument which towers above the town. The images above only really show half a plot as I broke the power cable at the top, hopefully tomorrow will be equally as nice a day and I can do some more thorough tests. The data for these images was gathered during the 35 minutes it took to walk from Lanternhouse to the top of Hoad Hill. The first shows the gps coordinates and elevation, the second shows airquality against latitude and longitude, the third shows the sniffer shortly before I broke it, and the fourth shows the route taken.
(Thanks to Martin Howse for the introduction to gnuplot).
[...] against landscape and came up with something not too disimilar from that which is visible (see: http://invisible.folly.co.uk/hoad-plots/) plotting ozone concentrations (z) against latitude and longitude (x,y) produces a dramatically [...]
[...] against landscape and came up with something not too disimilar from that which is visible (see: http://invisible.folly.co.uk/hoad-plots/) plotting ozone concentrations (z) against latitude and longitude (x,y) produces a dramatically [...]