Some notes on the broader concerns of the invisible cartographies project:
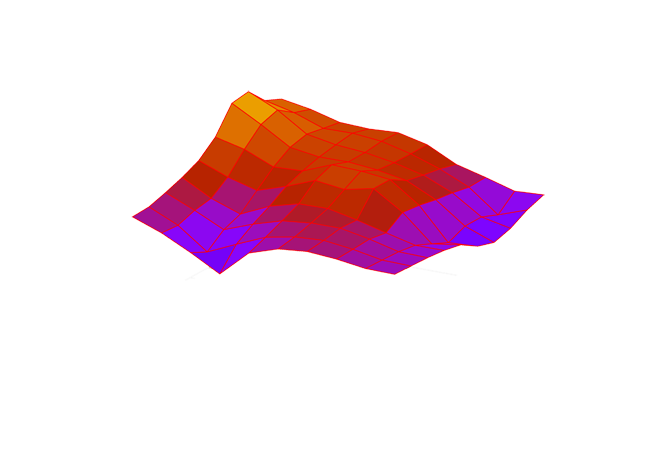
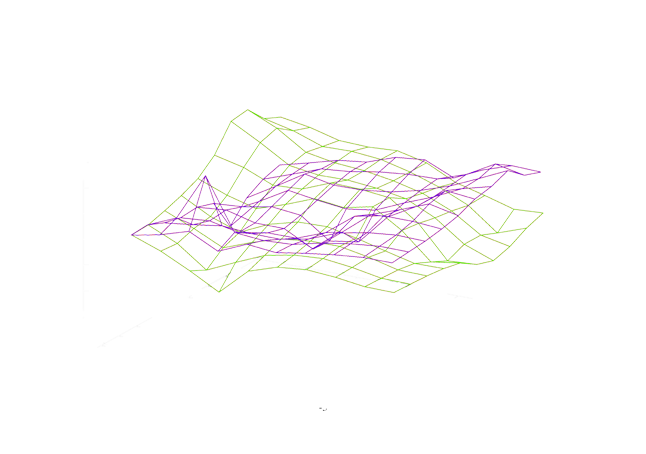
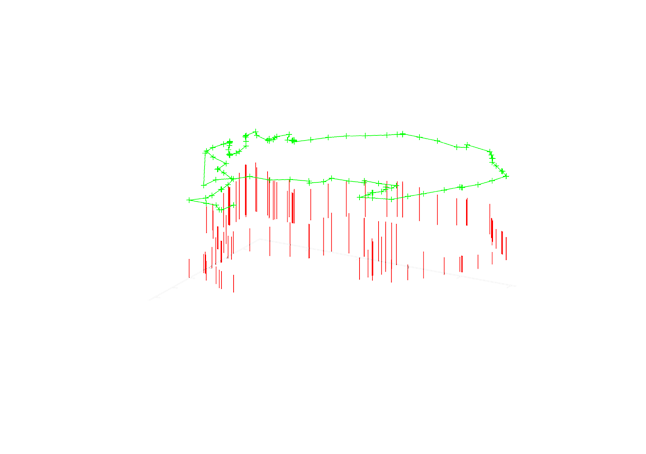
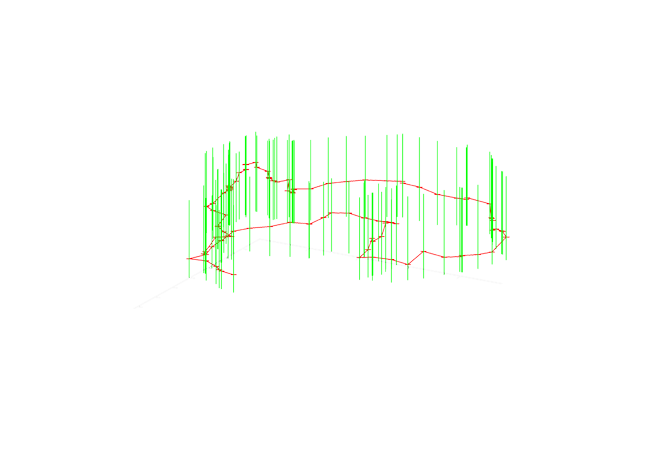
There are two sides to the invisible dynamics of the landscape revealed by this project. The first presents these dynamisms as components or qualities of the landscape as an objective reality, as fluctuations that are part of the landscape itself and not simply perceived fluctuations or subjective variations determined as such according to given thresholds of perception. The second is not wholly separate but certainly different in that it is focussed upon these same fluctuations as they occur within the proximity of a human body. This latter point refers to the data gathered by the mobile or bluetooth canaries which log fluctuations in localised atmospherics against latitude and longitude, fluctuations occurring around the human carrying the device and therefore charting an atmosphere to which the carrier or walker contributes through their breathing or other gaseous expulsions.
Proxemics
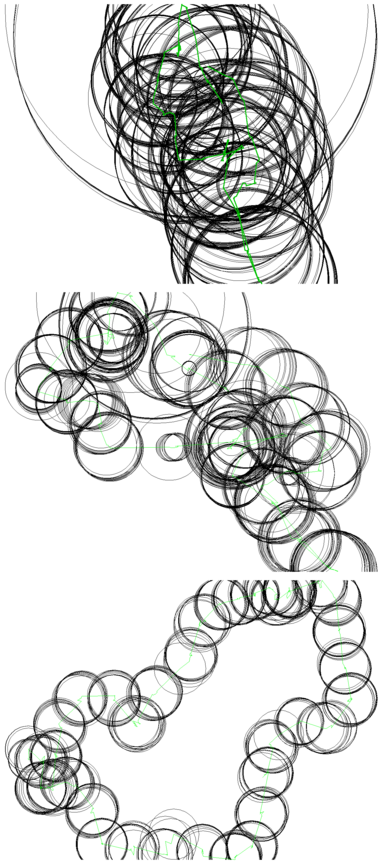
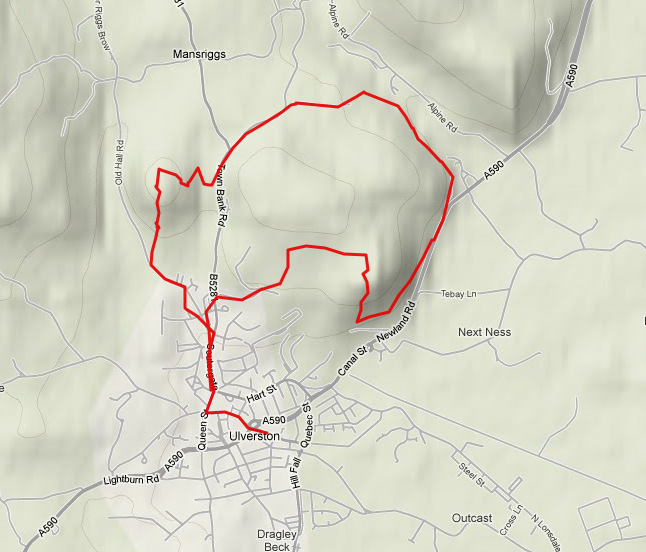
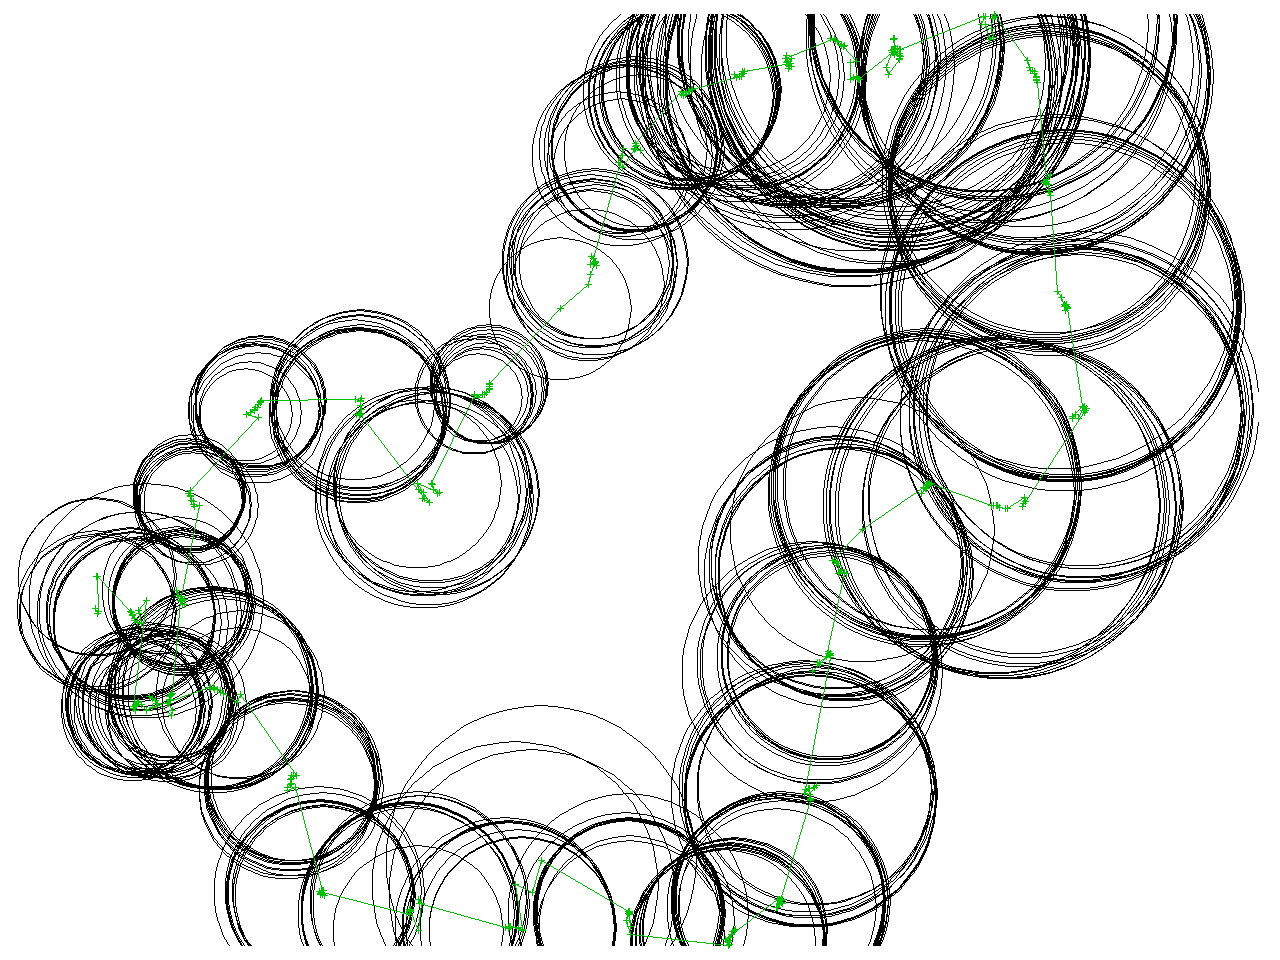
The above image is an attempt to show the second of the two orientations mentioned above. The faint green line shows a walk around Ulverston, the centre of each circle indicates a point on the walk at which a sample of the air was taken. The varying diameter of the circles shows fluctuations in air quality. This seems like a particularly suitable way of expressing a kind of gaseous proxemics visually. Proxemics is a term taken from the work of Edward T. Hall. Proxemics can be thought of as the study of personal space, but more precisely it’s socio-cultural or broadly contextual flexibility. A proxemic boundary can be considered broken when another person stands too close. Anyone with a sibling has surely unknowingly experimented with proxemics on long car journeys as a family: one child puts a hand close to the body of the other while claiming that they’re “not doing anything” as their is no physical contact being made. The other child calls out to the parent that their brother/sister is “in my space”, the limit of this space being perceived to be highly ambiguous and often getting little support from the parents. The proximity of the hand to the body of the brother or sister is, however, certain to annoy due to proxemic or personal space being transgressed. While from the outside, or the front of the car the boundaries of the spaces between kids in the back are hard to determine, the kids know precisely where they lie and how to manipulate them. This is of course a really simple example of the complex components and contextual determinants of personal space, which Hall describes in more detail (see The Hidden Dimension). Of particular interest to my own work is Hall’s discussion of auditory and olfactory proxemics, or the contribution of sound and smell to the determination of personal space. The work I’m doing as part of this residency can’t really be considered proxemic research as proxemics are always concerned with the thresholds of interpersonal space, and much of the work I’m doing involves walking alone or in small groups with the focus being placed upon the material composition of an invisible space rather than the interpersonally determined thresholds of personal space, invisible or otherwise. The reason for bringing this up here is that the work being done in mapping atmospheres that circle the body can perhaps be thought of as impersonal proxemics, insofar as it is concerned with the particular elements that contribute to a personal atmosphere that circles individuals and constitutes an ambiguous boundary. While this is less about interpersonal space, this is due to the fact that it is more concerned with how impersonal and inhuman elements nonetheless contribute to what we think of the personal or the space of the self.
Diffuse Bodies
This project is orientated around the diffuse interactions of bodies, human bodies, bodies of air, micro and macroscopic bodies; it busies itself charting the spatio-temporal contingencies of the confused and corpuscular space of which the self is composed. The human as one such body appears in this schema as being composed of―as well as constantly decomposing into―a corpuscular space or atmosphere that both surrounds and permeates individual, proxemic territories. This project approaches the self in terms of a corpuscular space that determines its proxemic territory, the self and not just the body, as this would be both too simple and reductive as the body is clearly observed as being composed of a number of potentially autonomous units. Perhaps there is a tendency to think of the self as a more unitary and unified mode of existence, such as where we write “I” but could just as easily read this symbol numerically as 1. The self thought as diffuse and dependent upon a corpuscular space is thought in a manner more thoroughly confused with a wider environment or atmosphere upon which it depends and with which it is enmeshed. In this model the self is thought as the composition of every element comprising the confusion of body, soul and ecological atmosphere.
The Particular Importance of the Invisible and Corpuscular
Foregrounding the invisible movements, interactions and constitutive contingencies of that which is apparently solid and stable serves to alter and embed a critical function within those thresholds of perception that are allowed to contribute to ontological determination where we hold too strongly to empiricism. We currently face catastrophe, and a factor contributing to the denial of our own implication within this calamitous future is the common ease with which stability and solidity are taken as the chief characteristics of reality, as it is perceived by the eye, ear, or senses in general. We cannot rely upon that which gives itself to perception, upon that which is easily and readily perceived according to inherent sensory capacities, and so we must forcefully bring to the fore elements and qualities of that which resists, ‘withdraws’, or rather exceeds the possibility of perception according to the thresholds of perception as they are simply given. The example that always springs to mind here is of the enormous problem of plastic in the oceans. I once heard a radio programme where two Women out doing research in the pacific described beautifully clear water on a lovely sunny day. They then went on to talk about how the water for miles around was saturated with microscopic particles of plastic that were clogging the up the bodies of marine life. The visible plastic was less of a problem, but would eventually be broken apart and spread itself over thousands of miles into the guts of thousands of fish, mammals, birds and so on. Where we remain focussed upon an understanding of the environment that relies upon that which is empirically justifiable such problems pass us by. In a similar way we might think of Ruskin’s plague-clouds and ‘calamitous winds’ which can be thought as close relatives of smog. While the smoke and smog of the industrial revolution may have cleared and been sandblasted from the walls of our cities, we now face an invisible yet nonetheless substantive threat in the form of pollution that persists, in part at least, due to its imperceptibility. On the subject of “plague-winds”, “smoke-cloud” and “dense manufacturing mist” Ruskin commented on “the uselessness of observation by instruments, or machines, instead of eyes”. It is this sufficiency of the given thresholds of perception that we must continually move beyond in order to take account of the substantive operations of the invisible and imperceptible, embedding them within our image of reality.
A Technical Note
gnuplot commands for the above plot:
set terminal png
unset tics
unset border
unset key
set output 'proxemic.png'
plot '~/Documents/FLI/Walks/24thNovember/[email protected]' u 2:3:($5/470000) w circles lc rgb "black", \
'~/Documents/FLI/Walks/24thNovember/[email protected]' u 2:3 w lp
