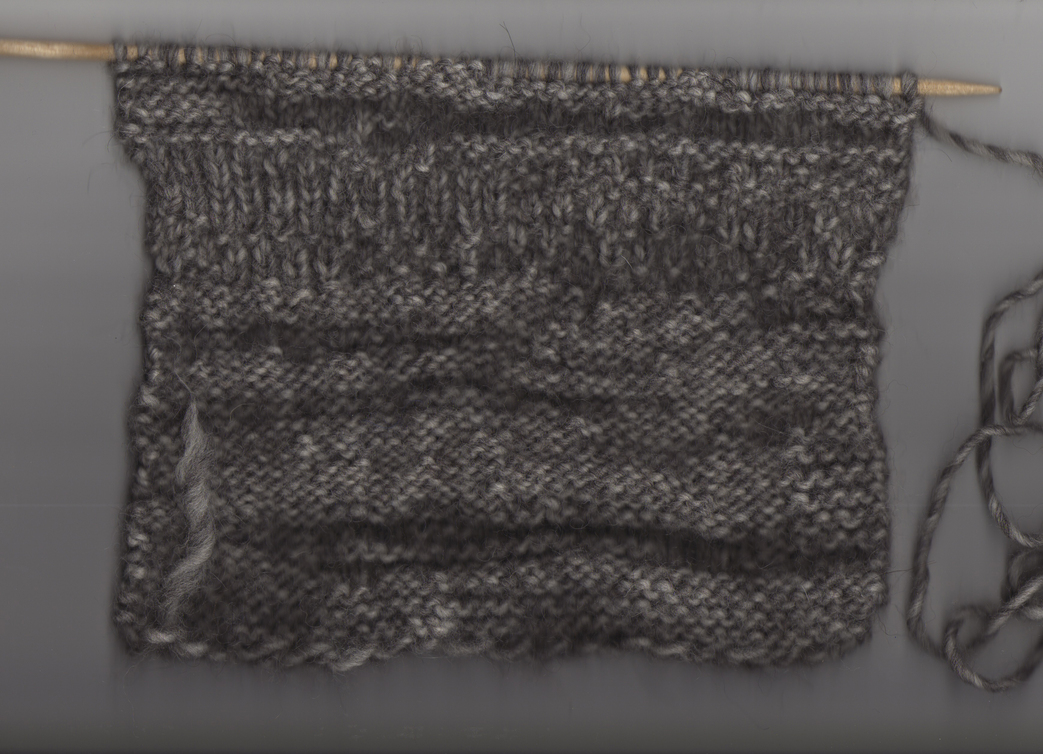
Above is evidence of my knitting prowess or lack thereof. This pattern is the simplest possible translation of the data gathered on a walk carried out on 25th November 2010 into simple knitting code. The file generated by the phone used to log the walk was reduced to include only changes up or down in ozone concentrations. Changes in intensity were then condensed but kept in their original order.
+ = k, - = p.
eg:
11.46.00	54.19878602027893	-3.0920612812042236	75.0	364
11.46.02	54.19880211353302	-3.0920612812042236	75.0	364
11.47.08	54.19882893562317	-3.092072010040283	77.0	358
11.47.09	54.198925495147705	-3.0913370847702026	77.0	358
11.47.10	54.198946952819824	-3.091326355934143	80.0	358
… became p6, and so on until I ended up with the following pattern:
k3
p1
k7
p2
k3
p1
k4
p9
k6
p39
k27
p1
k9
p2
k4
p77
Tomorrow I move onto colours.
Ideas on how to integrate the location data with the shifts in airs when creating patterns are warmly received.